SEO KPIs for Seasonal Businesses: Stop Reporting Month Over Month

A pool builder loses half its search demand every fall. Report YoY, share of search and lead quality so the SEO report stops blaming SEO for the calendar.
Picture the September report for a pool builder. Organic sessions: down 40% from August. Leads: down. Rankings: flat. The client reads the first line, the account manager spends the call explaining, and nobody talks about the work. Here's the thing, though: nothing went wrong. The weather changed.
Month-over-month is the default comparison in almost every SEO report template, and for a seasonal business it's the wrong one. You end up grading SEO against the calendar. Let's fix the KPIs instead.
Month-over-month reports blame SEO for the calendar
Look at the national search demand for "inground pool" over the last year. In June 2025 it hit 49,500 searches in the US. By December it was 5,400. That's an 89% drop, and no SEO campaign on earth is going to change it.
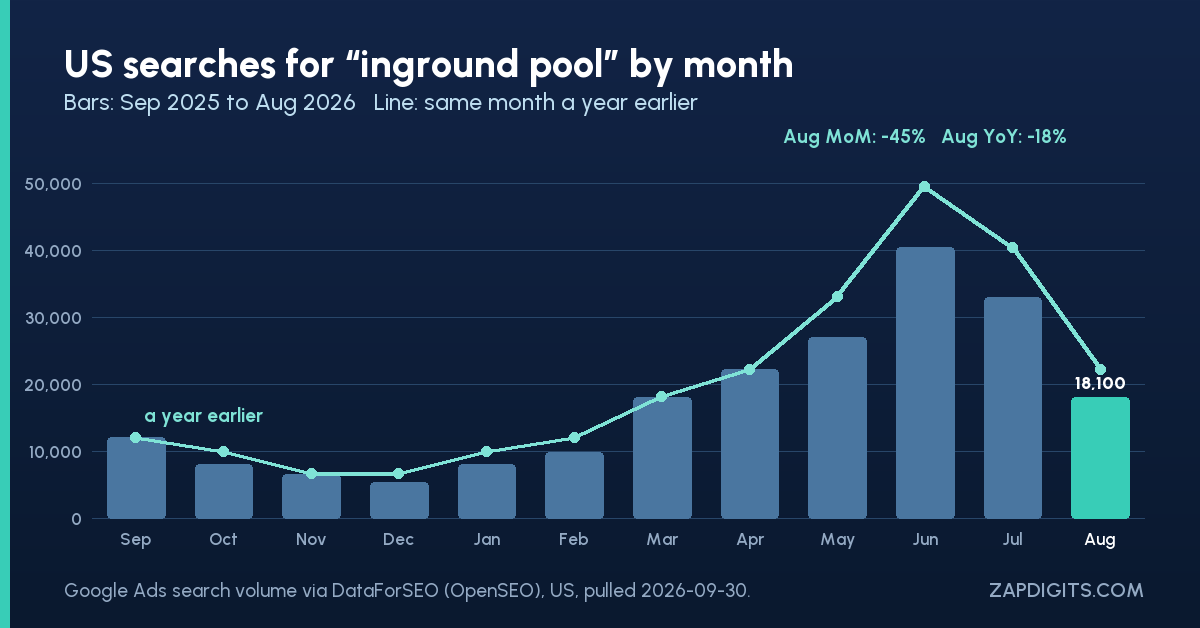
Now read August 2026 the two ways a report can read it:
- Month over month: 33,100 in July to 18,100 in August. Down 45%. Panic.
- Year over year: 22,200 last August to 18,100 this August. Down 18%. A real signal, and a much smaller one.
The same data flips the other way in winter. January 2026 was up 50% on December. A MoM report would call that a breakout month. It was New Year's resolutions and people pricing next summer.
So if your client sells pools, patios, HVAC, tax prep, snow removal or anything else with a season, MoM tells you about the weather, and YoY tells you about the business.
Year-over-year growth is the comparison that holds the season still
YoY growth compares a month with the same month last year, so the season cancels out. It's the one comparison that lets you see whether the work moved anything. In GA4 that's a date-range comparison against the same period last year; in Search Console it's the "compare" tab set to the previous year. Put it in the headline row of the report, not on page four.
Alex Radetic of Nuvo Agency does this with his home-service clients, and he doesn't hide behind traffic when he does it:
That's the tone you want. YoY isn't a trick to make a bad month look good. It's the fair test.
A couple of rules keep it honest:
- Compare full weeks or full months, and watch for holidays that moved (Easter, Labor Day, a Black Friday that fell in a different week).
- Annotate anything that changed the baseline — a site migration, a new location, a lost GBP listing — or the YoY line lies in a new direction.
- Keep a 13-month view on the dashboard so the client can see this month's point next to the same month last year without asking.
Share of search tells you if you lost demand or lost the market
YoY still has a blind spot: what if the whole category shrank? That's what happened to "inground pool" this year. June, July and August 2026 all came in 18% or more below 2025. A builder whose organic traffic fell 18% YoY didn't lose ground. They held it.
That's what share of search measures. The simple small-business version:
- Pull monthly search volume for the handful of terms that actually bring you leads (Google Trends or any keyword tool with monthly history works).
- Divide your organic clicks on those terms by that volume.
- Track that percentage YoY.
If demand fell 18% and your clicks fell 10%, your share went up. That's a sentence a client understands, and it's true.
Lead quality is the SEO KPI a pool builder actually pays for
Take a builder like Backyard Resort Pools. An inground pool is a five-figure purchase, so one qualified lead in February can be worth more than fifty form fills from people pricing an above-ground pool in July. Traffic can't show that. Lead quality can.
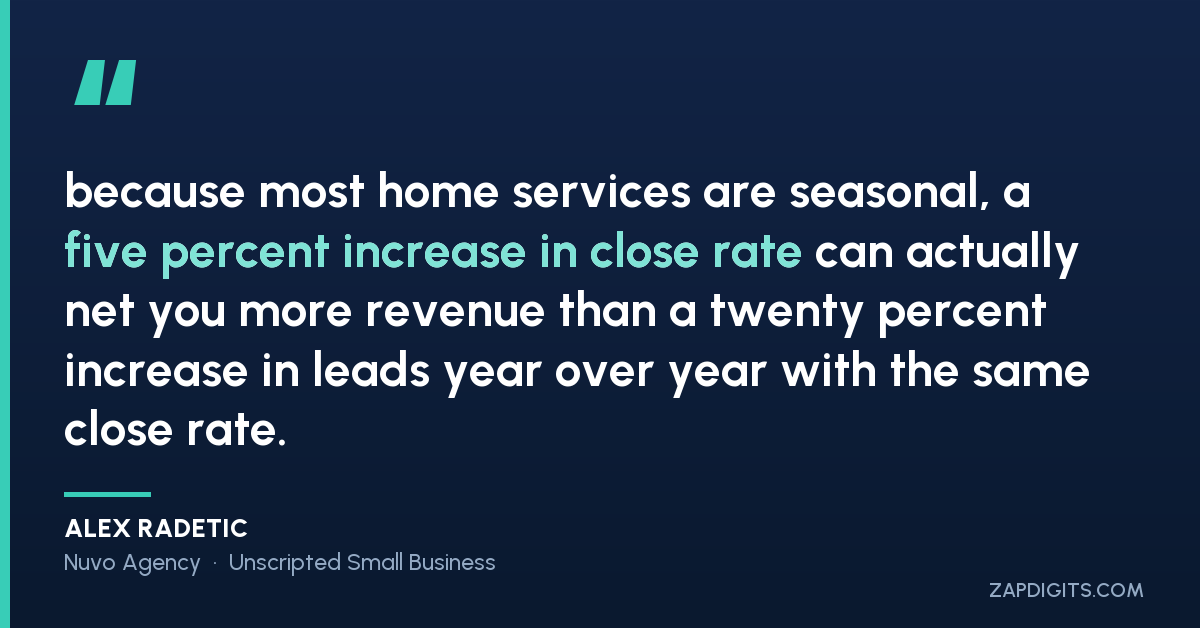
Alex put the math more sharply than any dashboard does:
So your seasonal KPI set should look something like this:
| KPI | Compare against | Why |
|---|---|---|
| Qualified leads (by source) | Same month last year | Leads are what the client pays for |
| Close rate on organic leads | Same season last year | Alex's point: this moves revenue more than volume |
| Share of search on money terms | Same month last year | Separates "demand fell" from "we lost ground" |
| Non-brand clicks | Same month last year | Shows SEO reach without the brand noise |
A goal-tracking dashboard that sets targets per month, rather than one flat line, keeps the off-season from reading as failure.
The off-season is when the compounding work gets done
Here's where most seasonal SEO plans fall apart: the team does nothing in November because "nobody's searching." That's backwards. The slow months are when you build the stuff that ranks by spring, and your report should show that work as leading indicators.
Three things worth doing, and reporting, in the off-season:
Build the content ladder. Alyssa Evans of Grow Your Strategy describes it as meeting the buyer at the first question and every question after it:
For a pool builder, the base is "how much does an inground pool cost." The next rungs are financing, permits, fiberglass vs gunite, and how long installation takes. Write those in winter.
Cite your sources. Drew Dorenfest of Client Magnet CRM got a small tax firm's post onto page one above IRS.gov by doing something most content skips. His rule: "the key to all of this, especially to get cited, is to cite your sources." Link the permit office, the manufacturer spec, the warranty terms. I went deeper on this in citing sources to become the cited source.
Clean up citations. Bradley Benner of Semantic Mastery defines a citation as "a published mention of usually at least two out of four data points" — brand, address, phone, website. Winter is when you fix the mismatched ones, because they're what AI answers and map results lean on when demand comes back.
Report those as counts: ladder pages published, sources cited, citations corrected. Alyssa's advice for the months when the traffic line looks flat: "you have to just kind of stand your ground and then the data will come later."
What goes in a seasonal SEO KPI report
Put this on the first screen, in this order:
- YoY qualified leads and close rate on organic leads.
- YoY non-brand clicks, next to YoY search demand for the money terms (so share of search is visible).
- The 13-month trend line, so the season is on the chart and not in the account manager's explanation.
- Off-season work shipped: ladder pages, cited sources, citations fixed.
Then MoM can live further down, labelled as what it is: a weather report.
If your reports still open with a MoM traffic delta, how to create automated SEO reports for your clients is the place to rebuild the template. What would your worst month look like if the report compared it to the right month?