What Is a Good CTR? Find the Page-One Rankings That Bleed Money
A good CTR depends on your position. Compare each page's actual CTR with what its ranking should earn, and fix the page-one rankings leaking clicks.
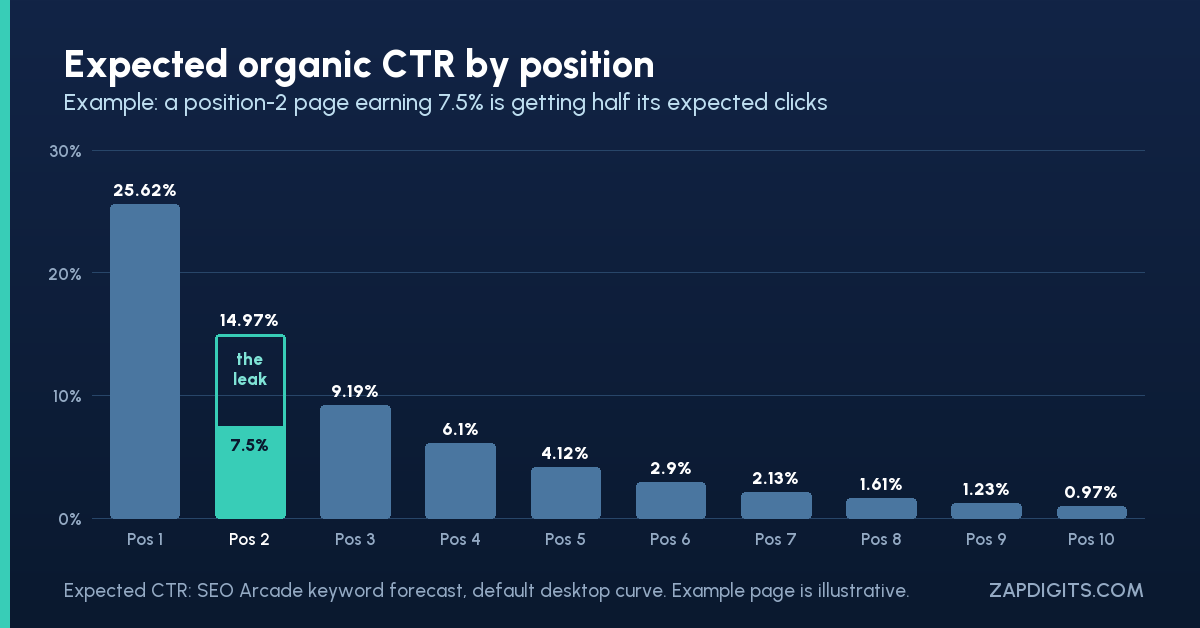
Here's a report line you've probably sent a client, or had sent to you: "Ranking on page one for 14 new keywords." It reads like a win. Well, the truth is that page one is a location, not a result. A page sitting at position two that gets half the clicks position two normally earns is losing money every single day, and the monthly report will never tell you, because the report celebrates the ranking.
David Wilson, EVP of Digital Marketing & AI at Zozimus, built a whole process around this gap. He calls it expected click traffic. Ross Hudgens, founder and CEO of Siege Media, found the same leak one level up, in the "best X" lists that decide who gets considered at all. Both told me about it on the Unscripted SEO podcast, and neither answer is "rank higher."
A good CTR depends on your position, not an industry benchmark
Search "what is a good CTR" and you'll get a single number, usually somewhere between 2% and 5%, pulled from an industry benchmark. That number is useless for SEO, because click-through rate is mostly a function of where you sit. Position one and position eight live on different planets.
The default desktop curve in the SEO Arcade keyword forecast puts position one at 25.62%, position two at 14.97%, position four at 6.1% and position ten at 0.97%. Your own curve will differ by industry, by device and by how many ads and AI Overviews sit above you, but the shape doesn't change: clicks fall off a cliff after the top three.
So "good" has to be a comparison. The question for every page is: is this page earning the clicks its position should earn?
Your organic CTR by position shows where page one is leaking
David's process is simple enough to explain in one breath, and he did:
Note the "we'll make this up." The 9% is his example, not a benchmark. The method is the point. Here's how you run it:
- Export pages from Google Search Console with clicks, impressions and average position for the last 3 months. Filter to pages with enough impressions to mean something (a few hundred is a sane floor).
- Pick a CTR curve. An industry curve gets you started; a curve built from your own non-branded queries is better, because it already includes your SERP's ads and features.
- For each page, look up the expected CTR for its rounded average position and multiply by impressions. That's expected clicks.
- Subtract actual clicks. Sort by the gap, biggest first.
The top of that list is where your money is leaking. It's rarely the page you'd have guessed.
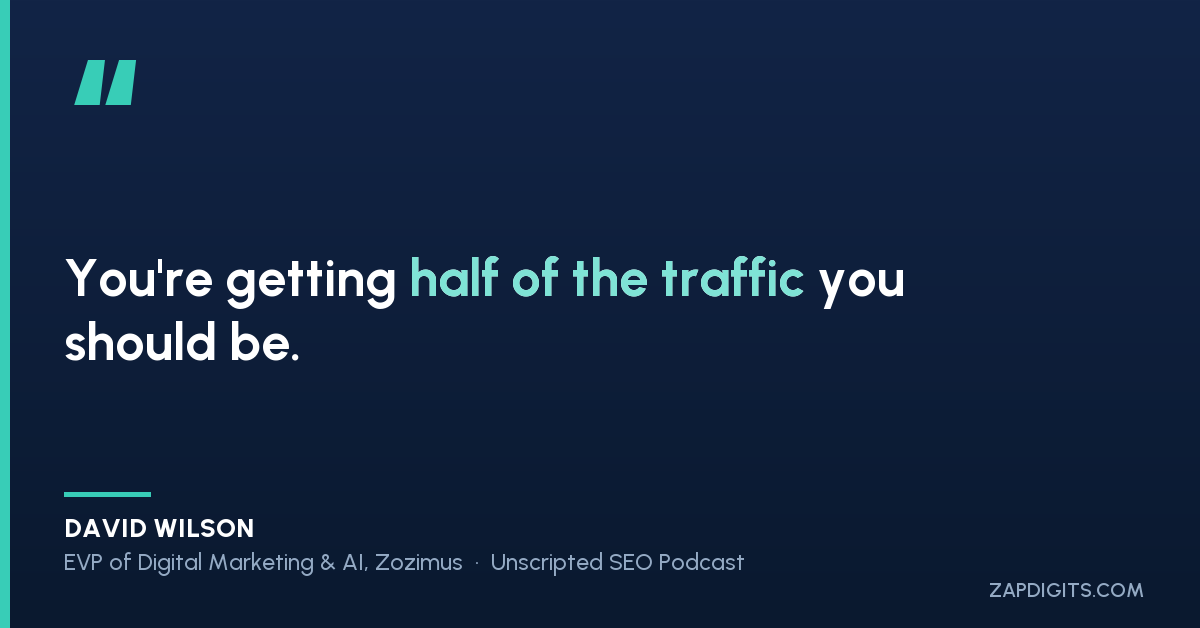
David's own example was a page in position two that hadn't adapted to the text block Google now pulls to the top of the result:
That's the reframe. You don't need a better ranking. You need the ranking you already have to do its job.
Striking distance keywords are the cheapest clicks you already own
Most teams treat "striking distance" as positions 11 to 20, the ones that need a push onto page one. Run the expected-CTR model and you'll find a second, cheaper striking distance: pages already in positions 2 to 6 that sit well under the curve.
The fixes for those are small, and they're mostly on the page:
- Rewrite the title and meta description so they answer the query, not your brand guidelines.
- Put the direct answer in the first 100 words, the "block of text" David was talking about, so Google has something worth pulling.
- Check what's actually above you. An AI Overview, a map pack or four ads will flatten any curve. If the SERP changed, your expectation should too.
- Look at intent. A position-three page that answers the wrong question will never hit its CTR, no matter how good the snippet is.
This used to be a slog. David was blunt about how long it took his team before AI tooling:
If you want the step-by-step version with the spreadsheet columns, I wrote it up as an expected-CTR SOP. If you're an agency and the analysis itself isn't the part you want to own, this is exactly the kind of recurring audit a white-label SEO partner can run under your brand while you keep the client conversation.
Zero-click searches moved the curve, so draw it from your own data
Here's the honest limit of the whole model: the curve is an assumption. Every published CTR study was measured on SERPs that no longer exist, and AI Overviews keep pushing organic results further down. A position-three result under an Overview isn't the same asset as a position-three result on a clean page.
That's why the best version of this uses your own Search Console data. Group your non-branded queries by rounded position, compute the median CTR for each position, and use that as the expectation. Then the pages that fall under it are underperforming against your SERPs, not against a study from 2023.
Two cautions before you trust the output:
- Branded queries will wreck the curve. Brand CTR runs far above anything non-branded. Filter it out first.
- Search Console hides a lot of queries. On one local service site we audited this year, 41.9% of clicks over 16 months had no query attached at all. Page-level numbers are complete; query-level numbers aren't. Build the model at the page level.
"Best of" lists decide who gets considered before anyone clicks
The CTR model finds leaks on your own pages. Ross Hudgens found one on pages you don't own.
The client was on page one, several times over, in the lists that should have carried them into the AI answer. They still got left out. Ross's diagnosis was positioning:
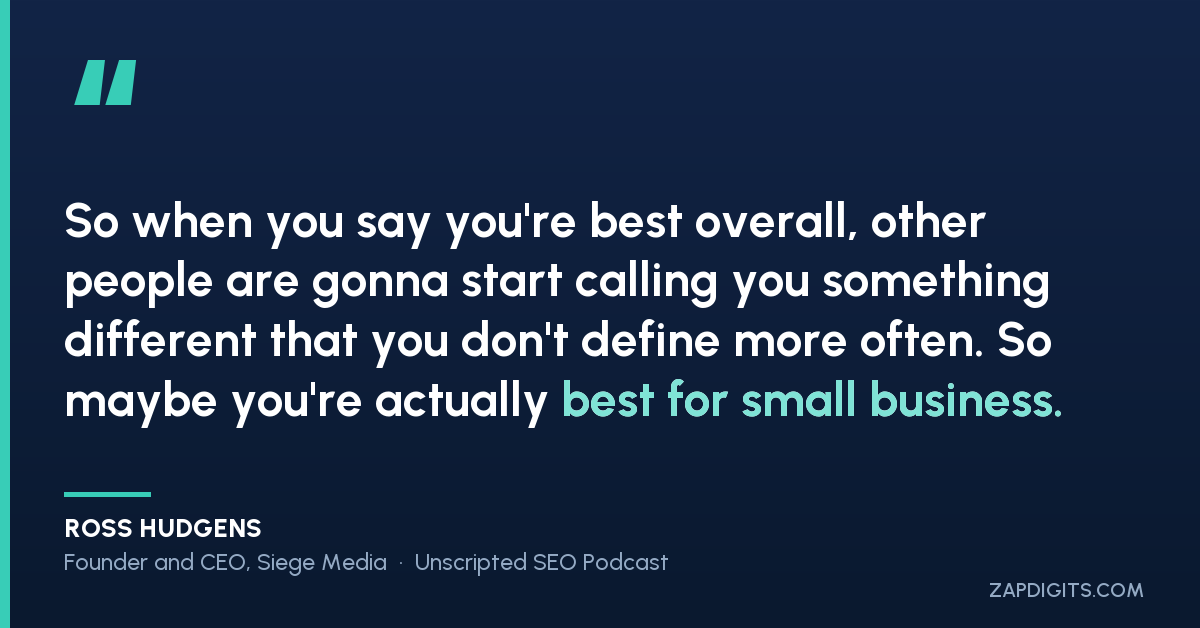
His advice is to stop fighting for "best overall" and own the segment you really win in, because the lists sort brands into "best for" slots, and AI answers follow those slots. In his words: "That effectively that co-citation vote is more what we're aiming for."
For your report, that means a ranking isn't the only thing to track on a "best X" query. Track whether you're named, what you're named as, and whether the AI answer for that query includes you. Page one with no mention in the answer is the same leak as position two with half the clicks.
What to put in next month's report instead of "page one"
You don't have to throw out rankings. You have to stop letting them stand alone. For each priority page, report:
- Position, plus expected clicks vs actual clicks for that position.
- The gap in clicks, and what one fix is being tested to close it.
- For "best X" and comparison queries, whether the brand is named in the lists and the AI answer, and in which "best for" slot.
A ZapDigits SEO report can pull the Search Console side of that into one view, and the AI visibility data covers the second half. The spreadsheet part is yours to build once.
So which of your page-one rankings is the most expensive one? And have you ever actually checked?